Surface complexation (CD-MUSIC)
Page
File
Figure
1
FeAsS(cd-music).ppi
Fe-As-H2O (CD-MUSIC) predominance diagram using the 'ht1' approach
2
gridFeAsS(cd-music).ppi
Fe-As-H2O (CD-MUSIC) predominance diagram using the 'grid' approach
3
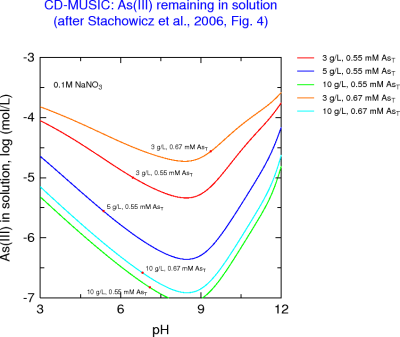
As3-shvrfig4.ppi
As(III) left in solution as a function of pH after adsorption by goethite
4
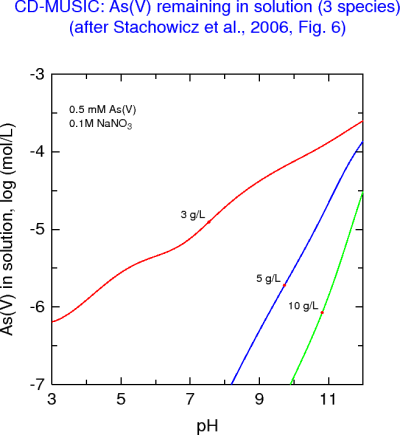
As5-shvrfig6.ppi
As(V) left in solution as a function of pH after adsorption by goethite
5
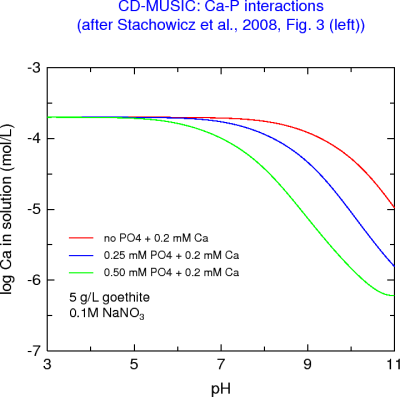
Ca-Pfig3left.ppi
Ca left in solution following Ca-P adsorption by goethite
6
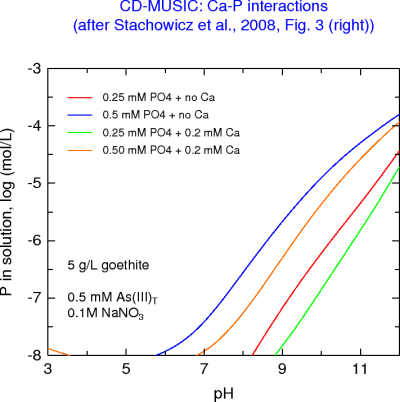
P-Cafig3right.ppi
P left in solution following Ca-P adsorption by goethite
7
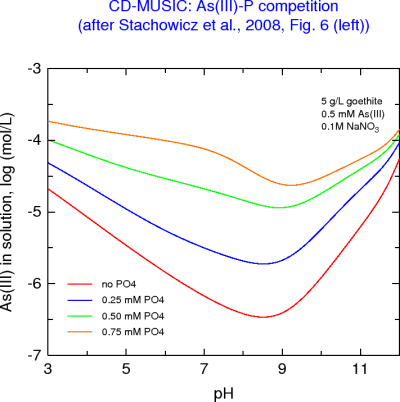
As3-Pfig6left.ppi
As(III) left in solution with As(III)-P adsorption by goethite
8
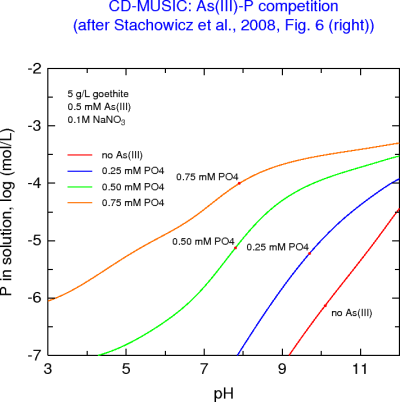
As3-Pfig6right.ppi
P left in solution with As(III)-P adsorption by goethite
9
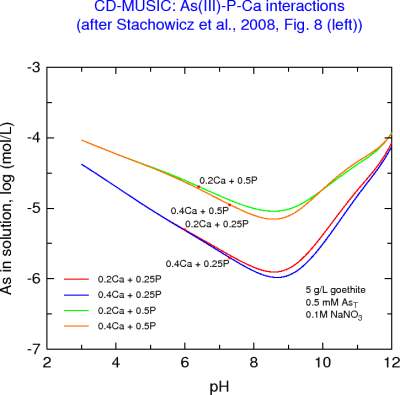
As3-P-Cafig8left.ppi
As(III) left in solution with As(III)-P-Ca adsorption by goethite
10
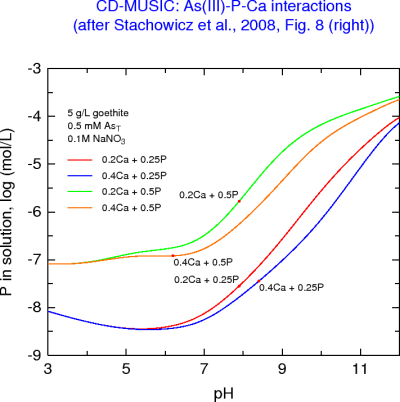
As3-P-Cafig8right.ppi
P left in solution with As(III)-P-Ca adsorption by goethite
11
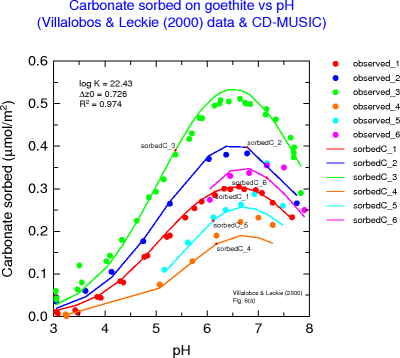
CO2goethitefit.ppi
Fit Villalobos & Leckie data for carbonate adsorption on goethite
12
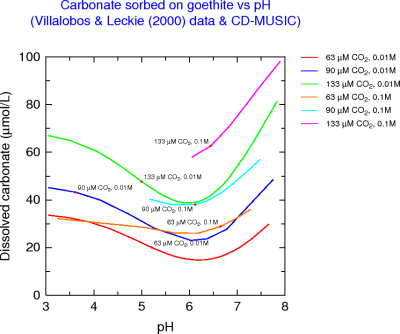
CO2goethitecarb.ppi
Simulation using the best-fit parameters for carbonate adsorption on goethite
13
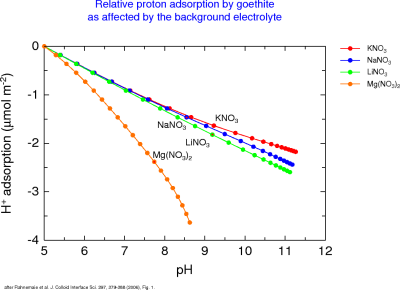
surfacecharging.ppi
Relative proton adsorption by goethite
14
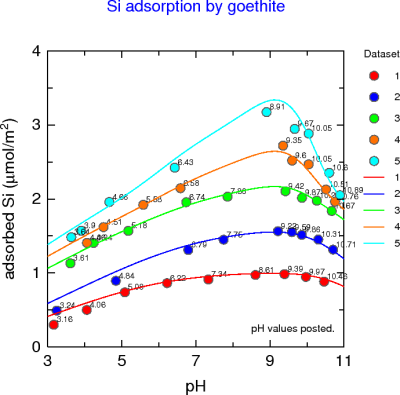
Si-goethite3a.ppi
Si adsorption by goethite
15
Si-goethite3b.ppi
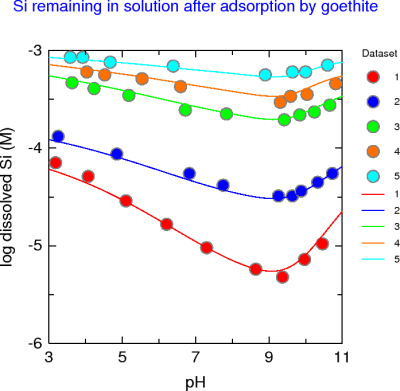
Si remaining in solution after adsorption by goethite
16
surfacechargeFhy.ppi
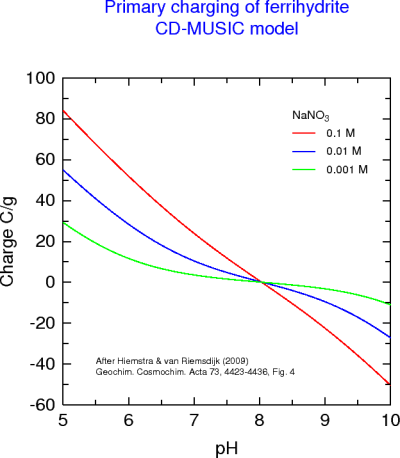
Primary charging of ferrihydrite (CD-MUSIC)
17
U-Fhyfig1a.ppi
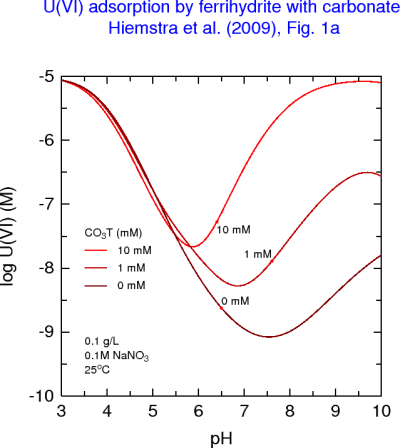
U(VI) remaining in solution after adsorption by ferrihydrite
18
U-Fhyfig1c.ppi
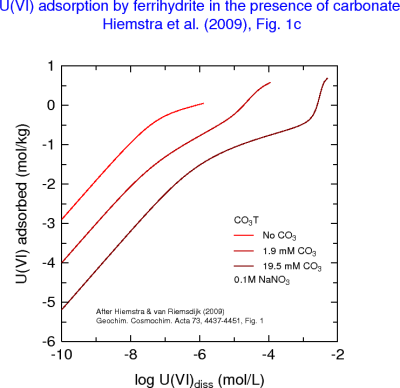
U(VI) adsorption isotherms on ferrihydrite
19
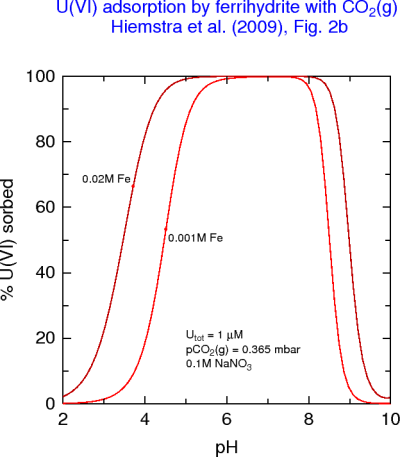
U-Fhyfig2b.ppi
%U(VI) sorbed on ferrihydrite vs pH and solid concentration (Utot = 1 ?M)
20
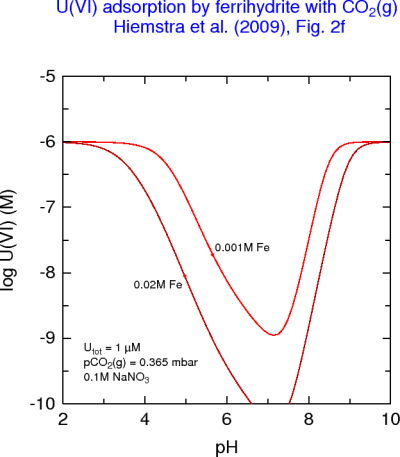
U-Fhyfig2f.ppi
U(VI) remaining in solution vs pH after adsorption by ferrihydrite (Utot = 1 ?M)
21
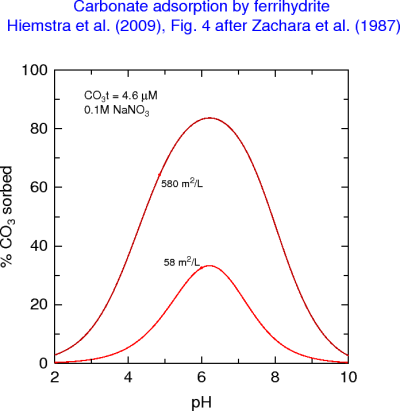
U-Fhyfig4.ppi
%C sorbed vs pH for ferrihydrite
_As1.png)
_As1.png)