PhreePlot
PhreePlot is a program for making geochemical plots and fitting geochemical models to observations with
PHREEQC.
Introduction
PhreePlot contains an embedded version of PHREEQC. PhreePlot sits on top of PHREEQC and makes it relatively straightforward to do repetitive PHREEQC calculations, the type of calculations that are often needed to make a plot. PhreePlot uses tags placed within the PHREEQC input file to identify places where substitutions are to be made and has several looping mechanisms to control the values substituted. It also contains software for generating Postscript (ps) plot files and optionally a bundled version of Ghostscript for converting these to a variety of other image formats. In addition to normal PHREEQC-type calculations, PhreePlot can be used to generate predominance diagrams, make 2D-contour plots and to fit PHREEQC models to observations using various optimization routines.
Download
- PhreePlot (Version 1) for Win32 and x64 Windows. N.B. It is likely that the next version of PhreePlot will be the x64 version only.
- If you do not have administator rights to install the above, use this x64 version which can be installed anywhere.
-
 Some Linux and Mac OSX binaries are available with installation notes here.
- A brief guide to the installation of PhreePlot.
-
Ghostscript 9.52, or locally from gs952w64.exe or gs952w32.exe for converting ps files.
-
GSview (Ghostgum Software Pty Ltd) for viewing ps files. Note that this requires Ghostscript 9.52 or earlier.
Documentation
Reviews and calculations
Molybdenum
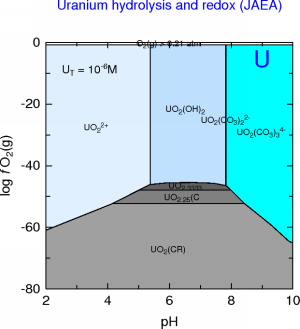
Uranium
List species app
Gallery
Acknowledgements
The following are acknowledged for their major contributions to the code in PhreePlot:
- DL Parkhurst, CAJ Appelo & SR Charlton: PHREEQC.
- KE Kohler: PSPLOT Postscript plotting library.
- MJD Powell & HSL Archive: VA05, NEWUOA and BOBYQA optimization routines.
- P Bourke: CONREC contouring.
A full list of Acknowledgements is given in the PhreePlot Guide.
Feedback
Please send David Kinniburgh (david@phreeplot.org) bug reports and any comments on the Windows Installer, program or documentation. Examples to add to the Gallery are also welcome.
You can automatically check whether you have the latest version of PhreePlot installed each time you run PhreePlot by setting the keyword 'checkForUpdate' to TRUE in the settings file ( pp.set).
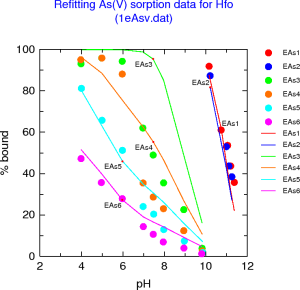
_As1-300.png)
_As1-300.png)